My Financial Planner
Track your portfolio, budget, and income flow with interactive visualizations. Plan your path to financial independence.
Try It Now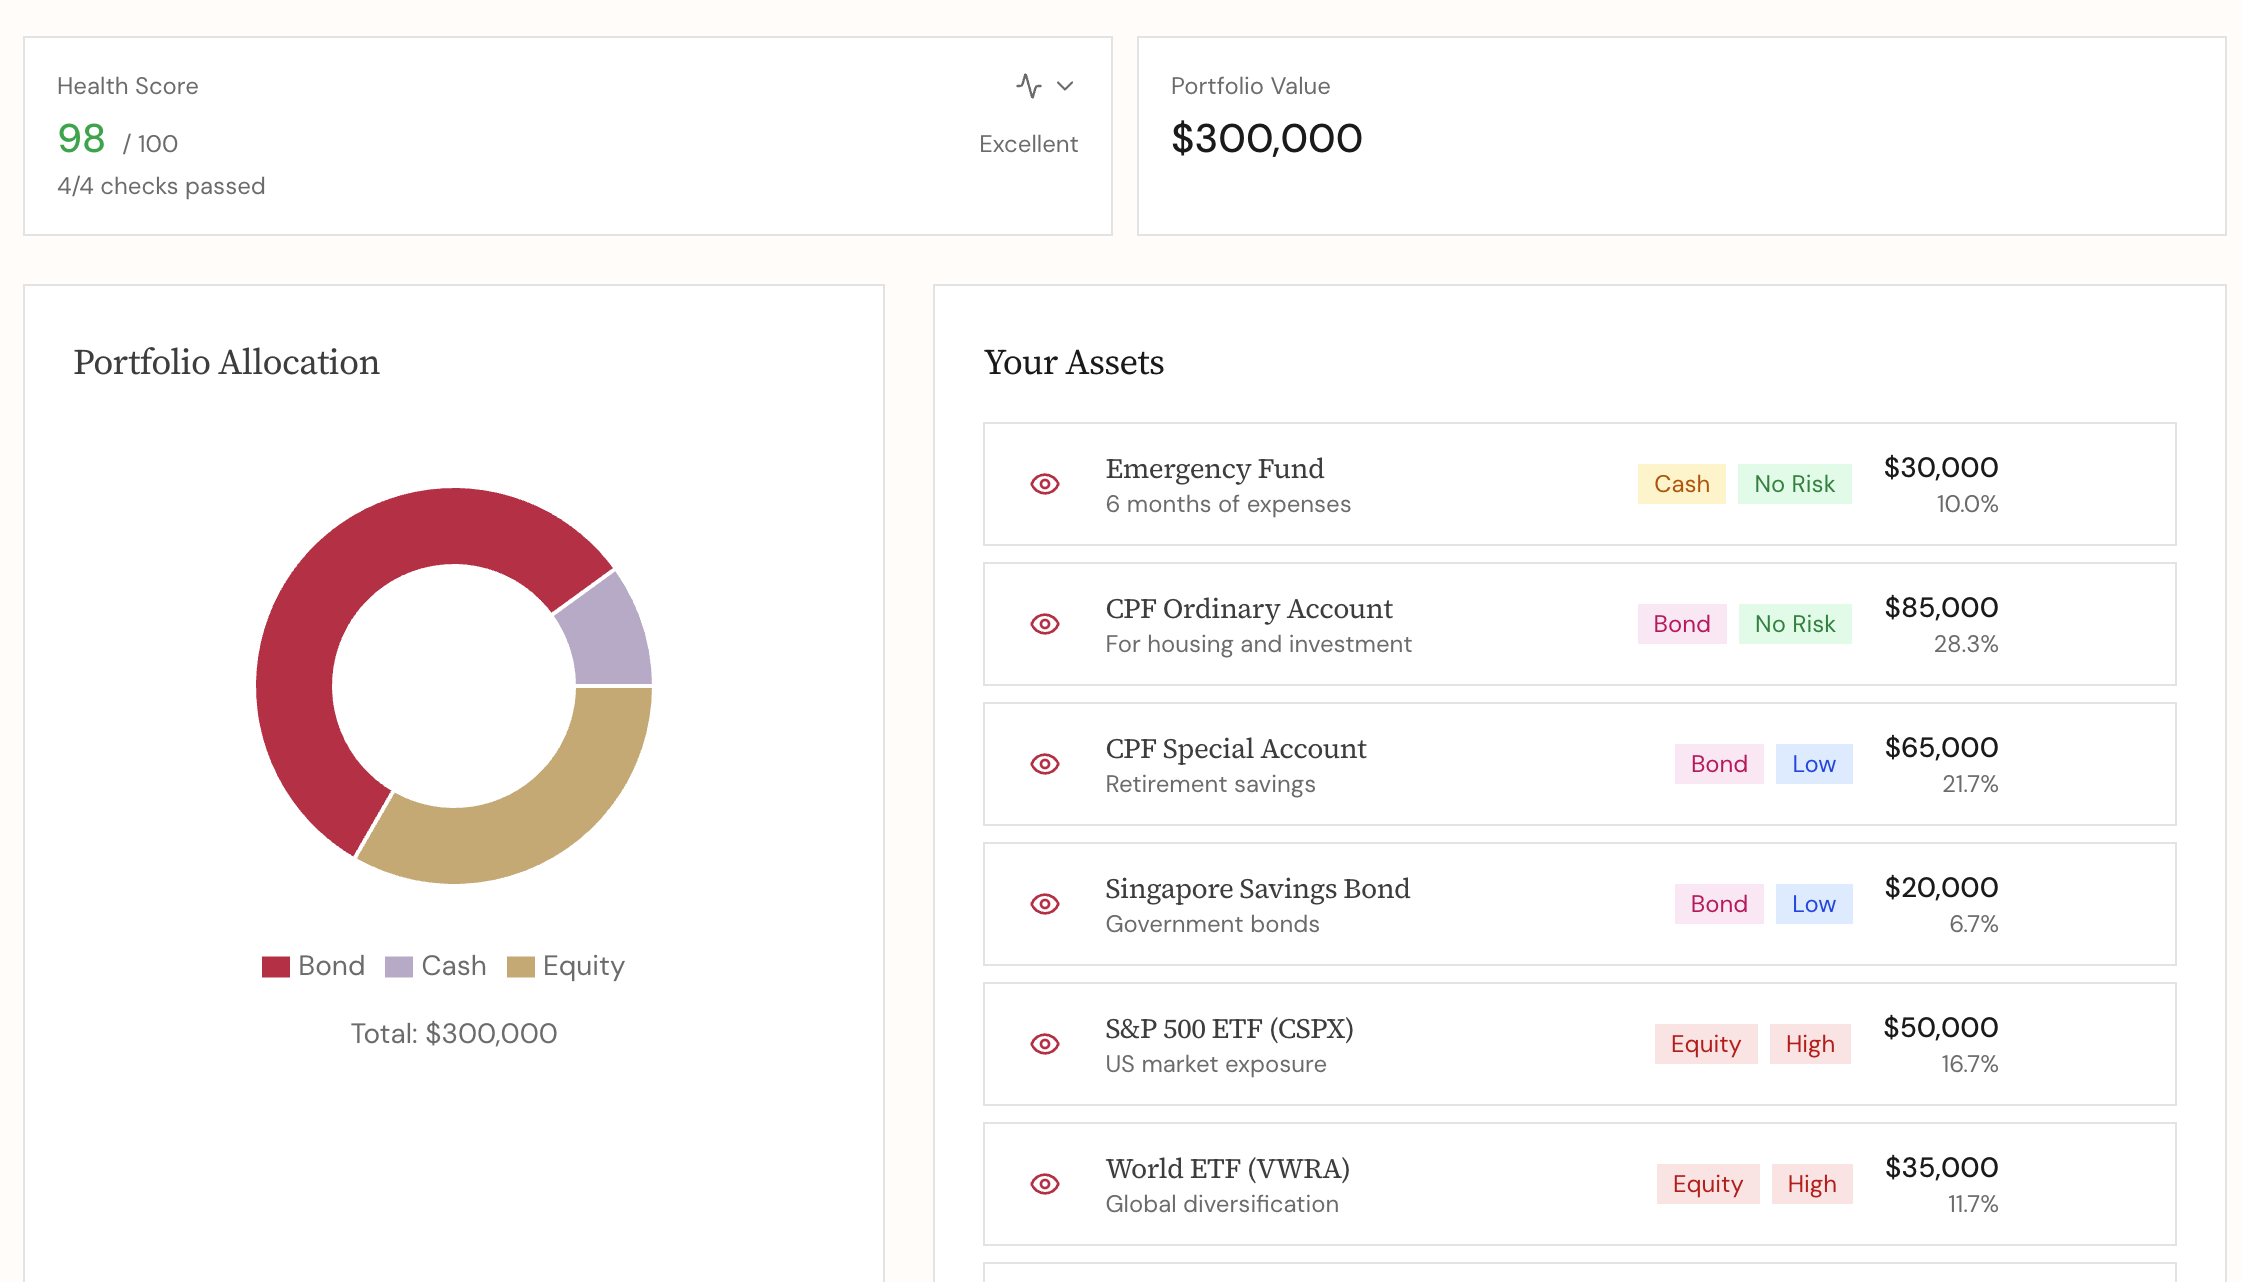


Five years ago, I started tracking my finances in a spreadsheet. One sheet for portfolio. Another for budgeting. A third for insurance premiums etc.
Every quarter when I wanted to answer a simple question — “Am I on track to retire at xx?” — I had to manually cross-reference different tabs, and still end up with a number I wasn’t confident in.
I then came up with a Python script to help me track the path to FIRE. Once in a while I open the script and update the numbers based on my current financial situation and tweak the portfolio allocation, saving rate, and expected returns to visualize the asset growth trajectory in the coming years.
I wondered: there has to be a better way.
There wasn’t — at least not one that fit how I think about money. So I built it myself. With the help of modern coding agents, I can do it in a breeze.
🤔 Why Existing Tools Didn’t Work for Me
Before building anything, I spent time with some tools available locally — DBS’s digiWealth Planner (and similar features on other banks’ and insurance companies’ web portals), PLAN with CPF (and MyMoneySense, which is ceasing operation and merging with CPF planner).
I was not satisfied with any of them:
Data privacy concerns. Out of curiosity, I used DBS digiWealth to sync my assets from sgfindex and played around with it. The next day, I immediately received a phone call from a DBS relationship manager trying to talk about opportunities to provide financial services to me. The tools provided by the banks are used for “data collection and inbound sales lead generation”. I believe most of the tools provided by banks or insurance companies are for this purpose.
Lacking context. CPF provides a series of tools to help Singaporeans improve their financial literacy and plan better. However, I found it too rigid and CPF-centric. With the retirement payout planner, I cannot adjust my retirement age, nor update my current asset allocation other than CPF, which made proper planning impossible for me. In the banks’ tool with sgfindex data sync, many of the insurance policies I bought for my family, e.g., my kids and my parents, are wrongly attributed to my own coverage because I am the policy holder (but I am actually not the insured), which makes the coverage calculation inaccurate.
One place to see my full financial picture — assets, coverage gaps, spending reality, and whether my current plan gets me to financial independence.
I ended up using Google Sheets to track different things and coded scripts to do complex calculations and plotting. It worked pretty well for me, until I built the web tool as a replacement.
🛠️ What I Built
The result is a browser-based financial planner, an interactive financial dashboard you build once and return to when your situation changes.
Here’s what it covers:
📊 Portfolio Management

This was the starting point because you can’t plan a future if you don’t know your present.
The portfolio view lets you input everything that counts as a financial asset:
- Emergency fund and cash savings
- CPF (OA, SA, MA separately — because the distinctions matter for planning)
- Properties — both your home and any investment properties
- Low-risk investments: bonds, money market funds, fixed deposits
- Higher-risk investments: equities, REITs, alternatives
The output is a portfolio health snapshot — a pie chart of your overall allocation and a separate view of your pure financial assets (excluding primary residence). If you’ve ever wondered what your actual stock-bond ratio is across CPF and your brokerage accounts combined, this is where you see it.
Why is this visualization important? My own experience: I discovered that my CPF makes up nearly 50% of my total financial assets when I was reviewing my portfolio allocation a few years back, which is higher than I intended. That single insight reshaped how I thought about my DCA strategy for the next few years. I shared this in my 2025 year-end financial review.
Add your CPF balances alongside your brokerage holdings and see your real asset allocation for the first time. Most people are surprised.
⛑️ Insurance Planner
This one was the most tedious to manage — but valuable, and I would say it is often overlooked in most financial planning processes. We are too familiar with delegating this to an insurance agent and being hands-off. However, reality taught me that we should spend effort and time to take full control of it, as it is the most important safety net for the family.
Most families accumulate policies over the years: employer group insurance, personal term plans, riders, whole life policies from a decade ago. They rarely exist in one place. When a claim happens, the scramble begins.
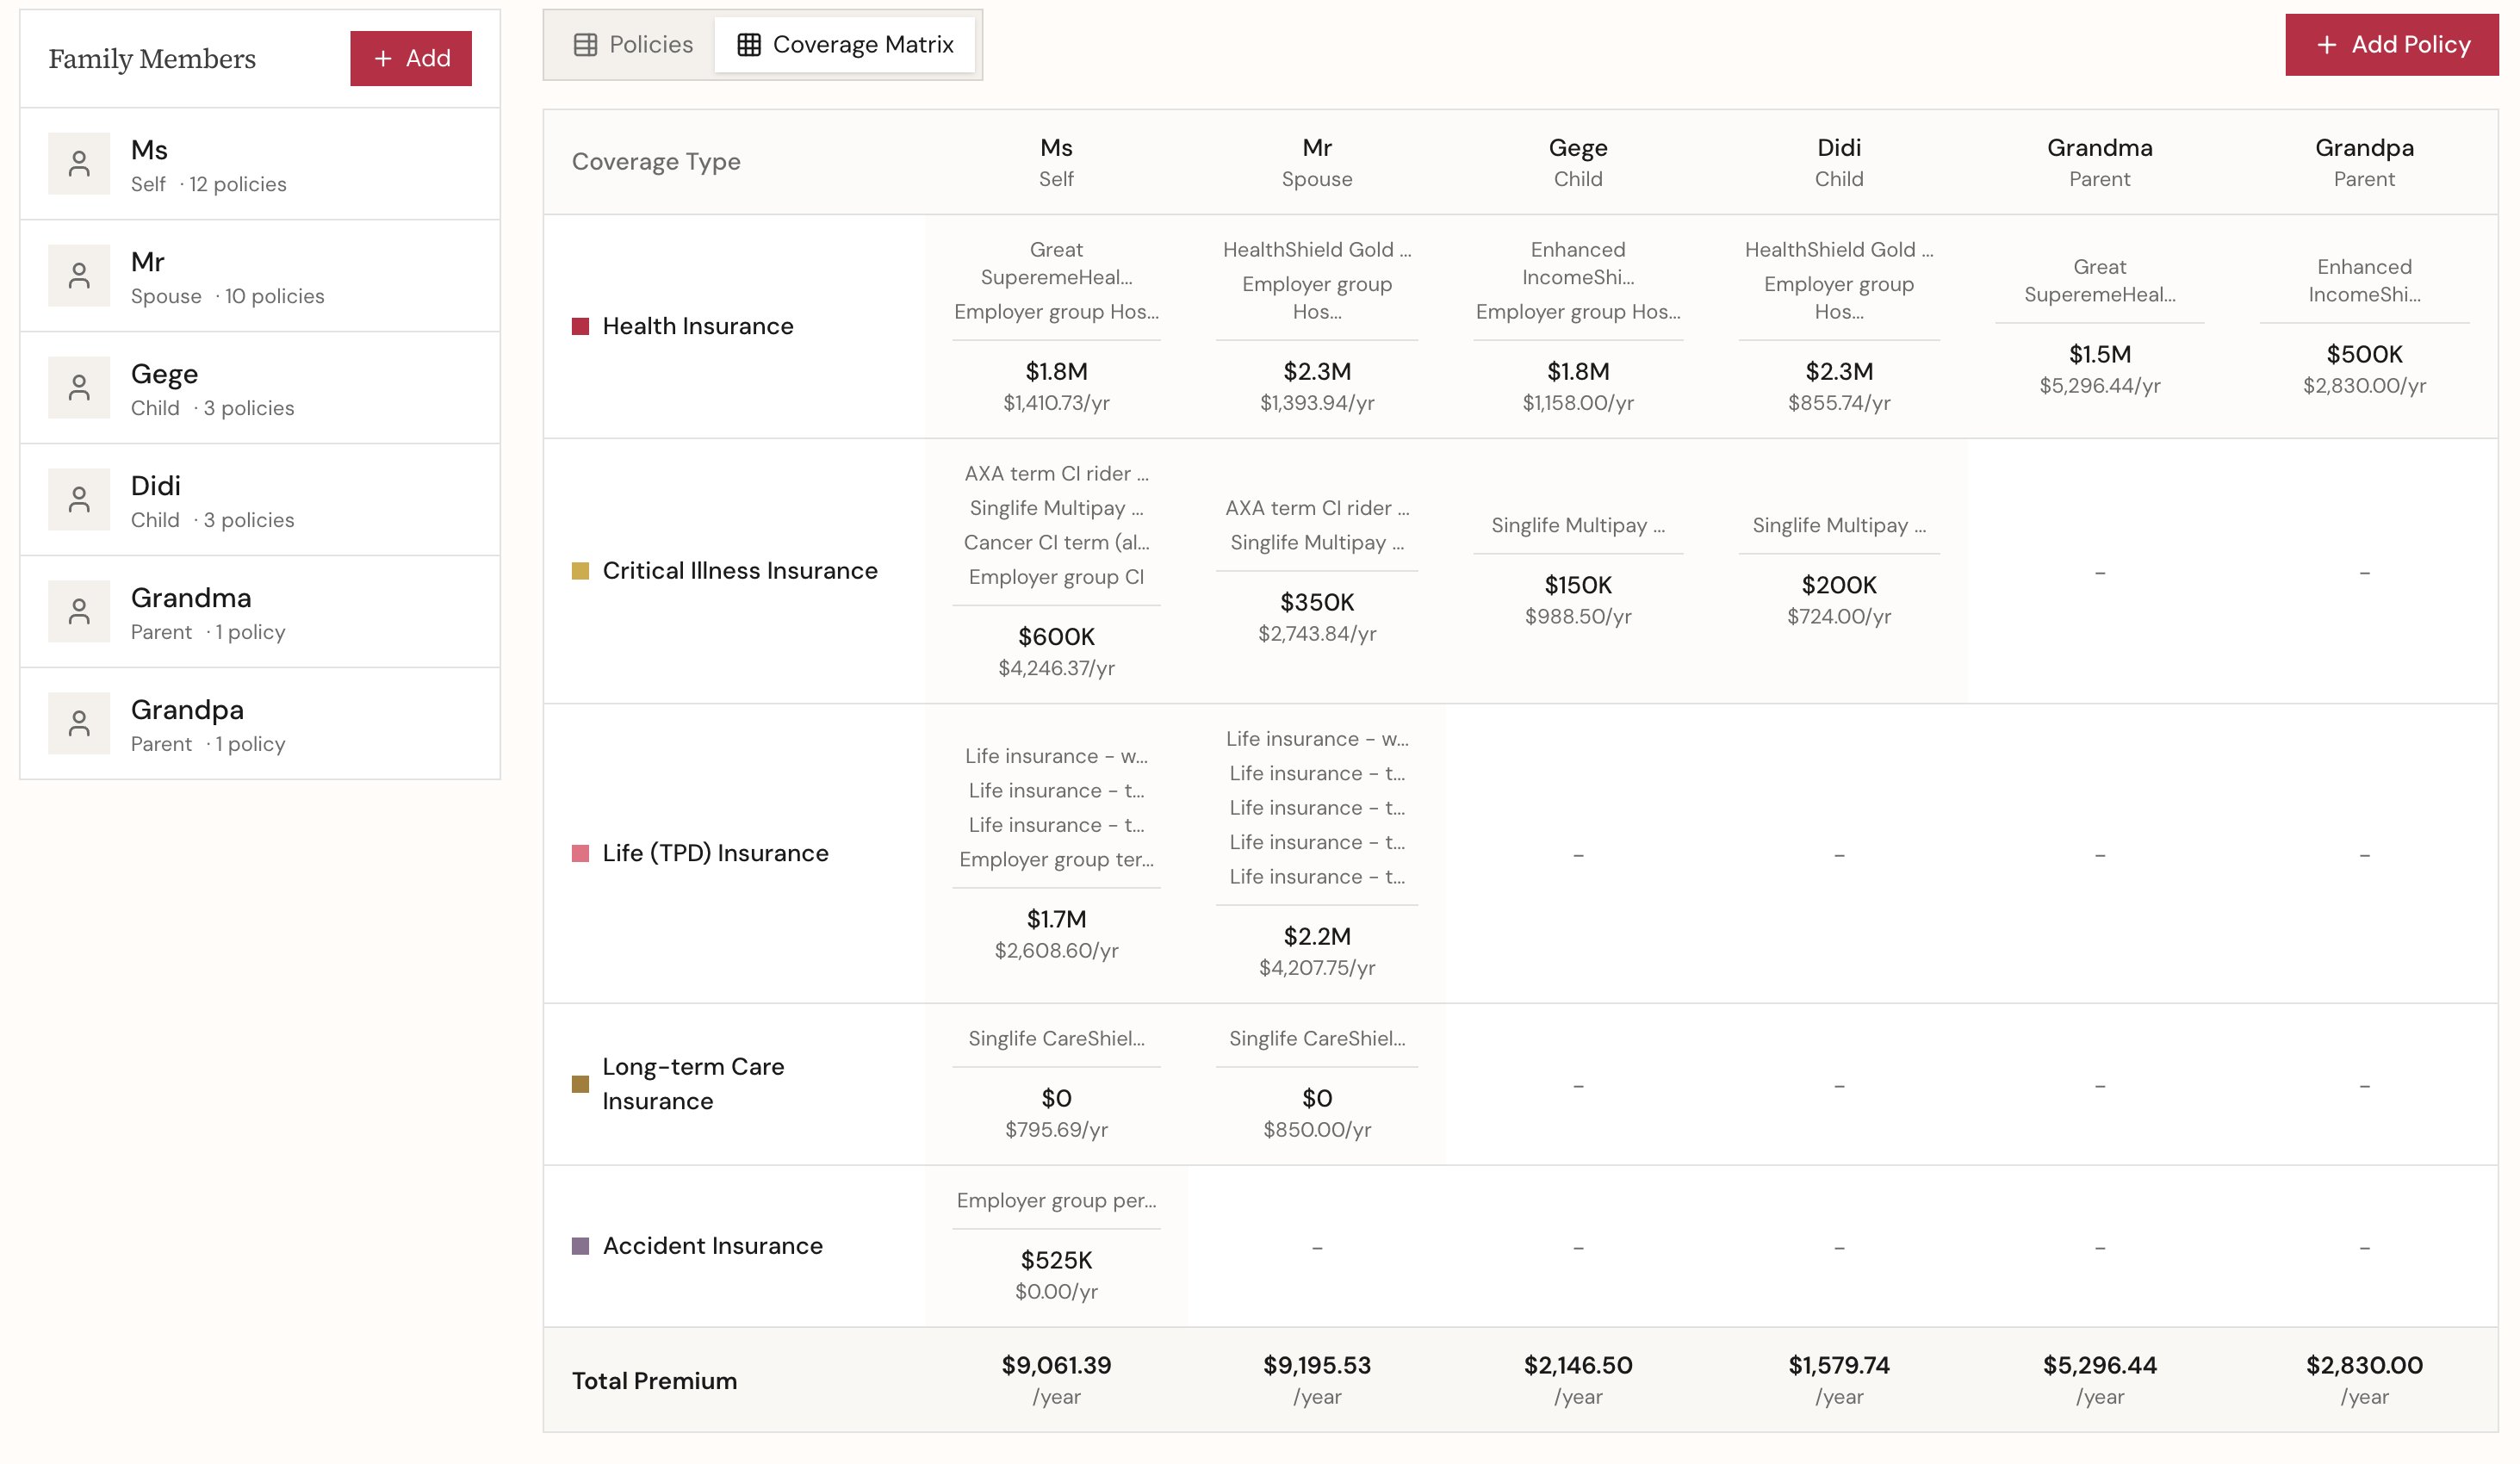
The planner supports all major coverage types: health, critical illness, life, long-term care, accident (general insurance to come: home, helper, car). The goal isn’t to tell you what to buy — it’s to make visible what you already have, where the gaps are, and what the coverage costs you in total.
When I first shared how I use a “coverage matrix” to organize and visualize my family’s insurance plans on social media, I got quite a number of requests for the template. However, it is tedious and error-prone to fill in and maintain such a complicated spreadsheet. I turned that into a guided feature in the web app.
Many families discover they have duplicated accident coverage but no long-term care protection, or not enough life policy on the breadwinner. The matrix makes these patterns obvious.
🛒 Budgeting
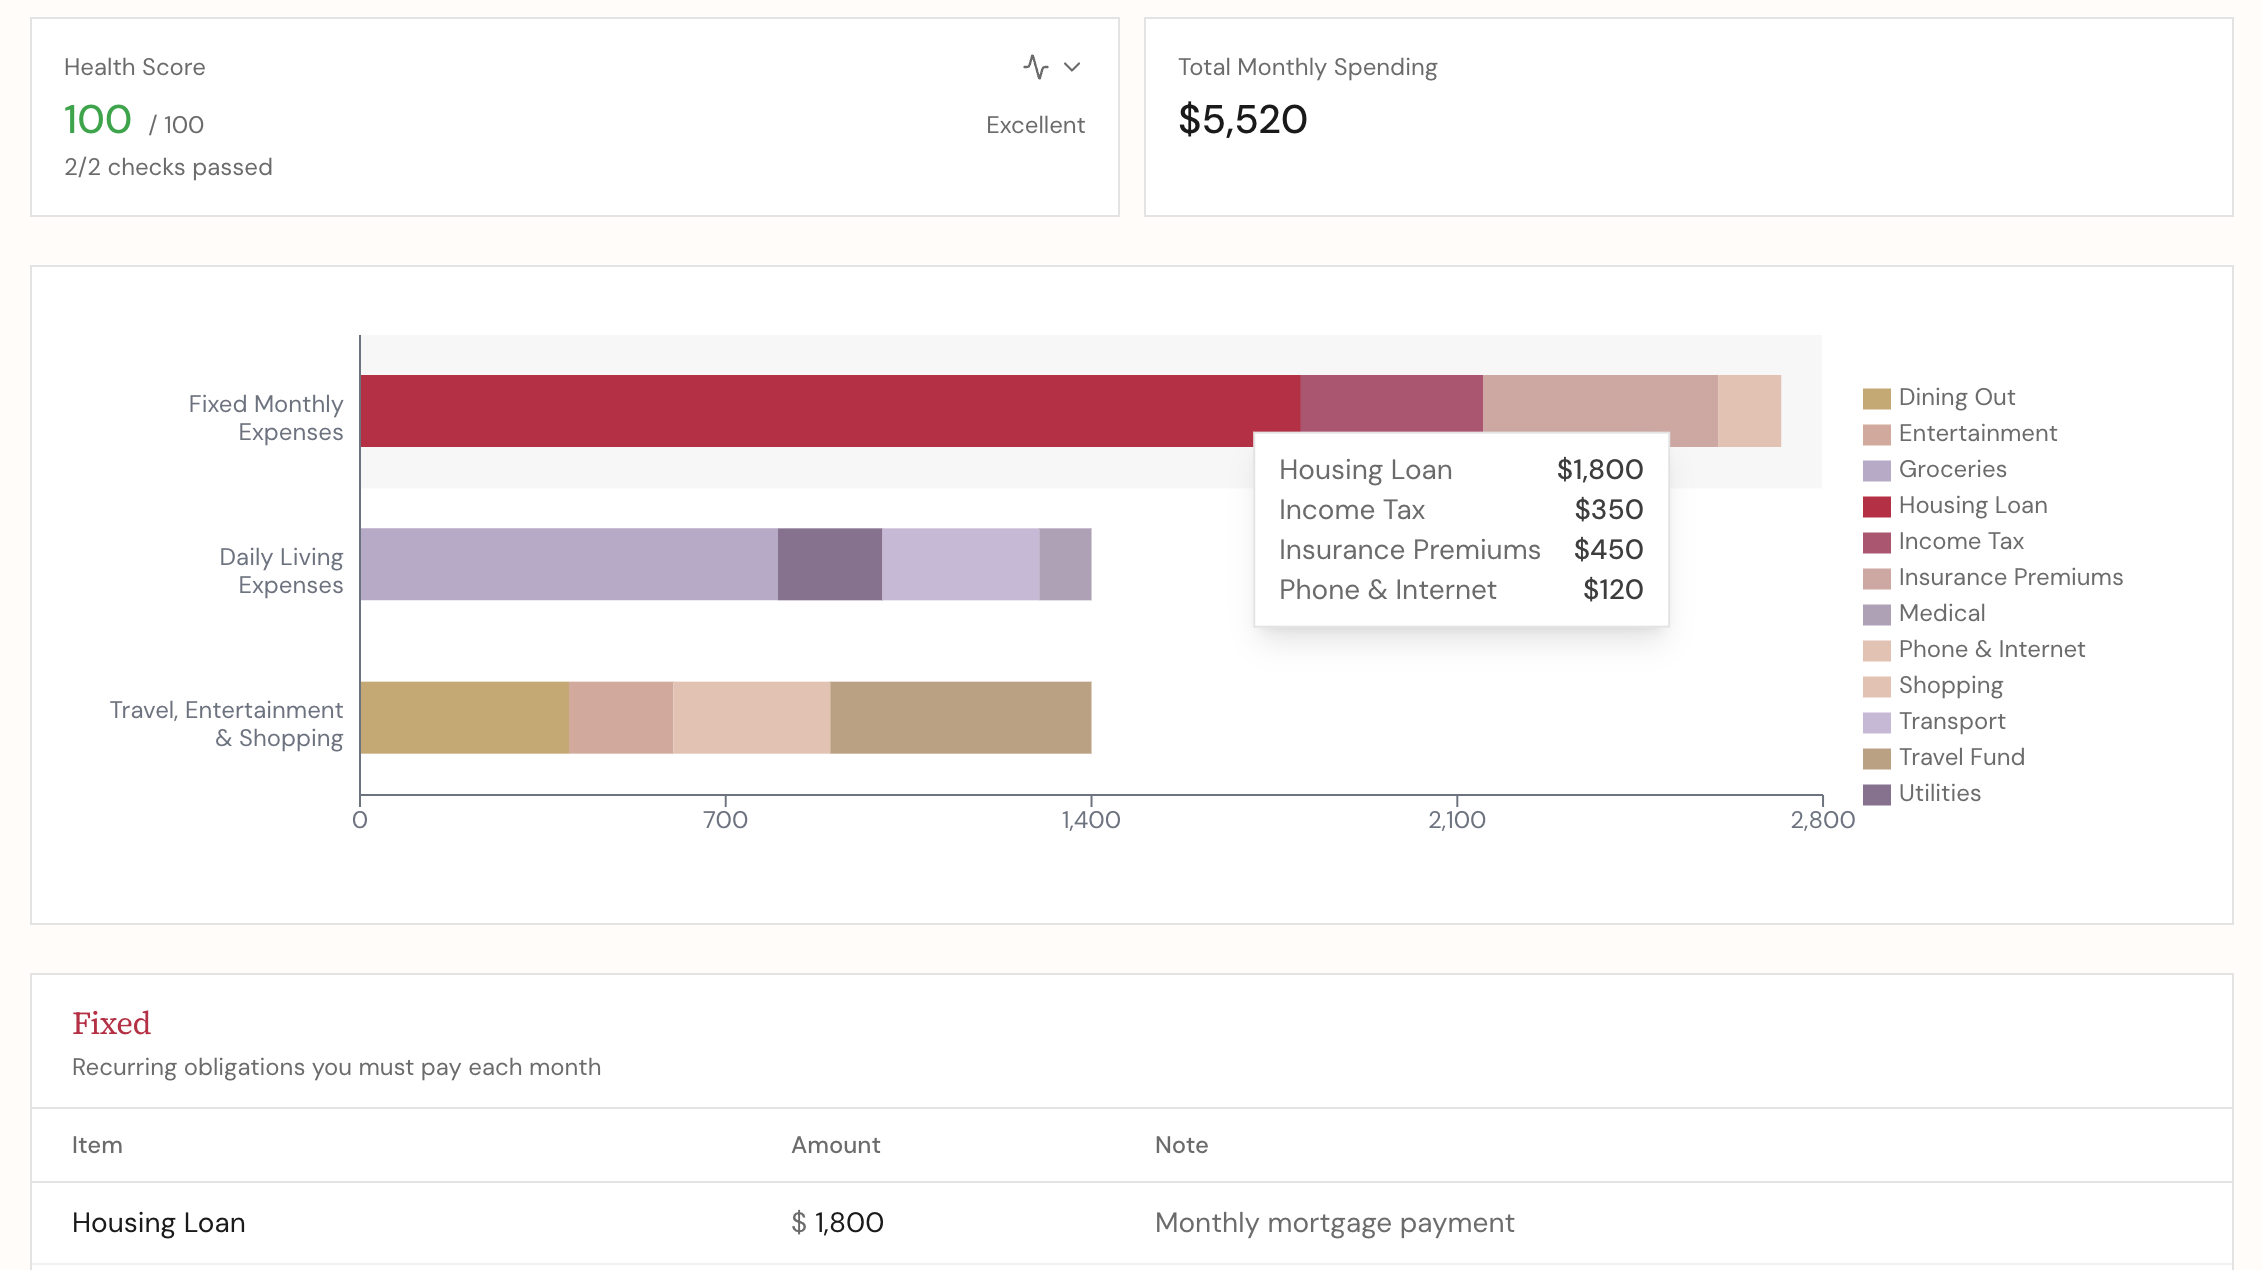
Not another expense tracker. This is intentionally a budget planner — you work from targets, not receipts.
Three spending buckets, based on how households should actually structure their outflows:
Fixed — Housing loan, insurance, property maintenance, helper, childcare, utilities, phone/internet
Essential — Groceries, weekday food, weekend dining, transportation, medical bills, home maintenance
Flexible — Family shopping, kids’ enrichment, travel and entertainment
The point isn’t granular tracking. It’s to get your monthly spending number close enough to reality that you can feed it into the FIRE path projection. A rough budget that you actually maintain beats a detailed one you abandon in March.
💸 Income planner
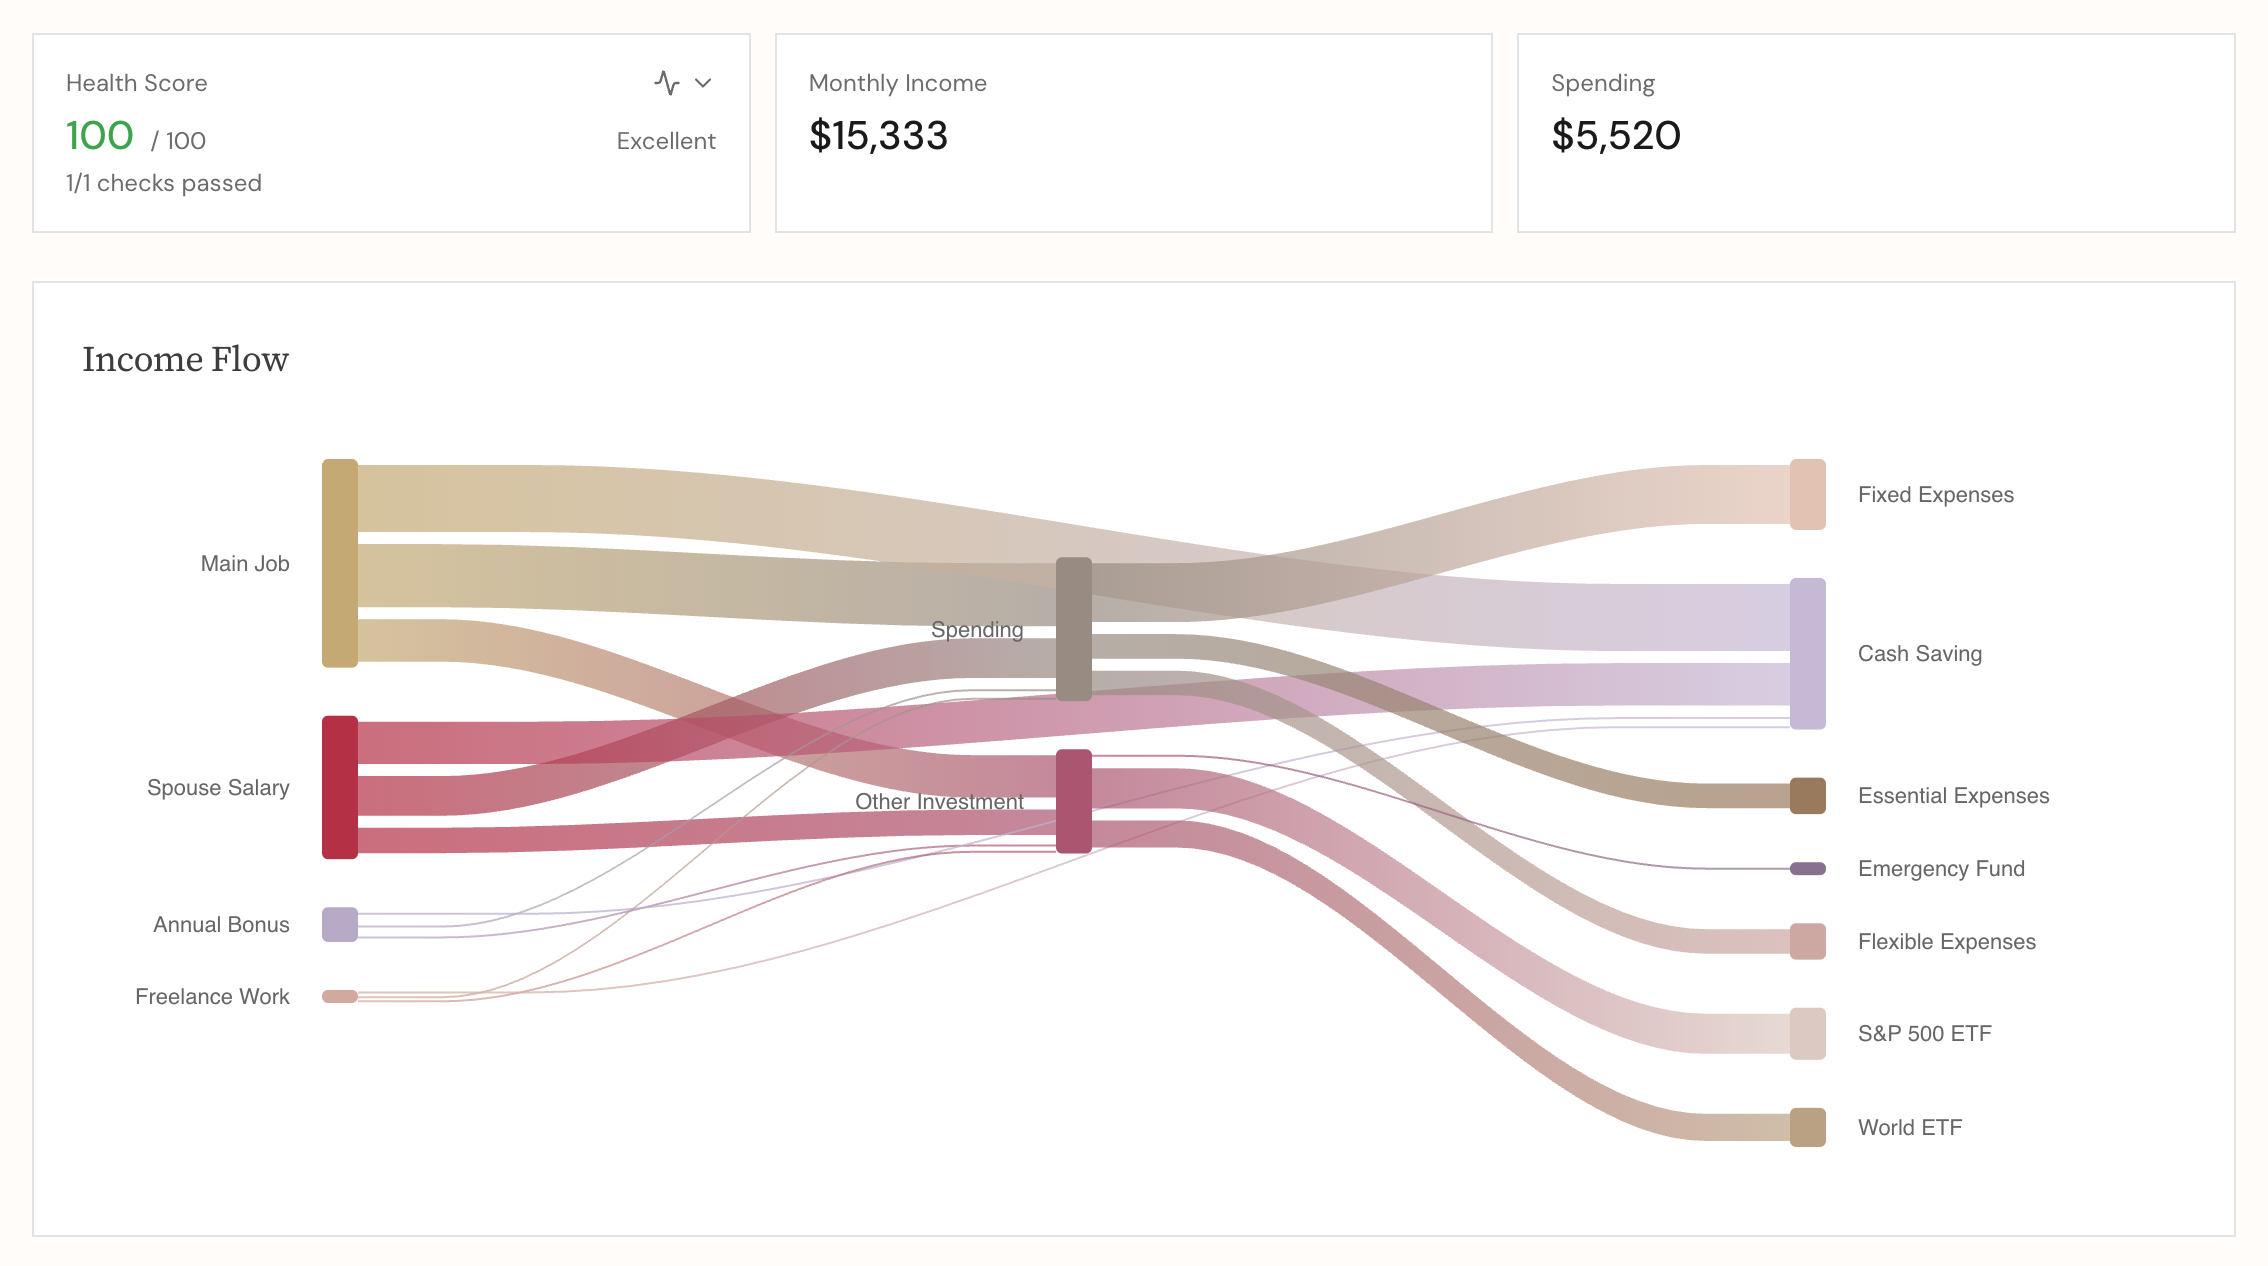
When I was reflecting on my money decisions and drafting the article on my money confession, I was brainstorming how I could best visualize my income routine. Sankey charts came to mind. I love how Sankey charts make the flow of money so vivid.
But fancy charts are not the main point. What we really care about here are two things — investment automation and savings rates. Listing all the monthly investment allocations helps you automate and thus enforce the DCA investment strategy. Calculating the magic number — savings rates — helps you remain confident in the path to your ultimate financial target. With these two, you can relax and spend and save effortlessly.
🔥 FIRE Path Builder
This is the feature I built the whole app around.
Input your:
- Current age and target retirement age
- Your expected active income at different age ranges
- Current net worth (synced from your portfolio) and expected annual investment return
- Your rebalance strategy at certain ages
- Monthly household spending (pulled from your budget) and adjustments at certain ages
- Large upcoming milestones (planned big-ticket item purchases) — property purchase, education spend, car replacement, kids’ university fees, etc.
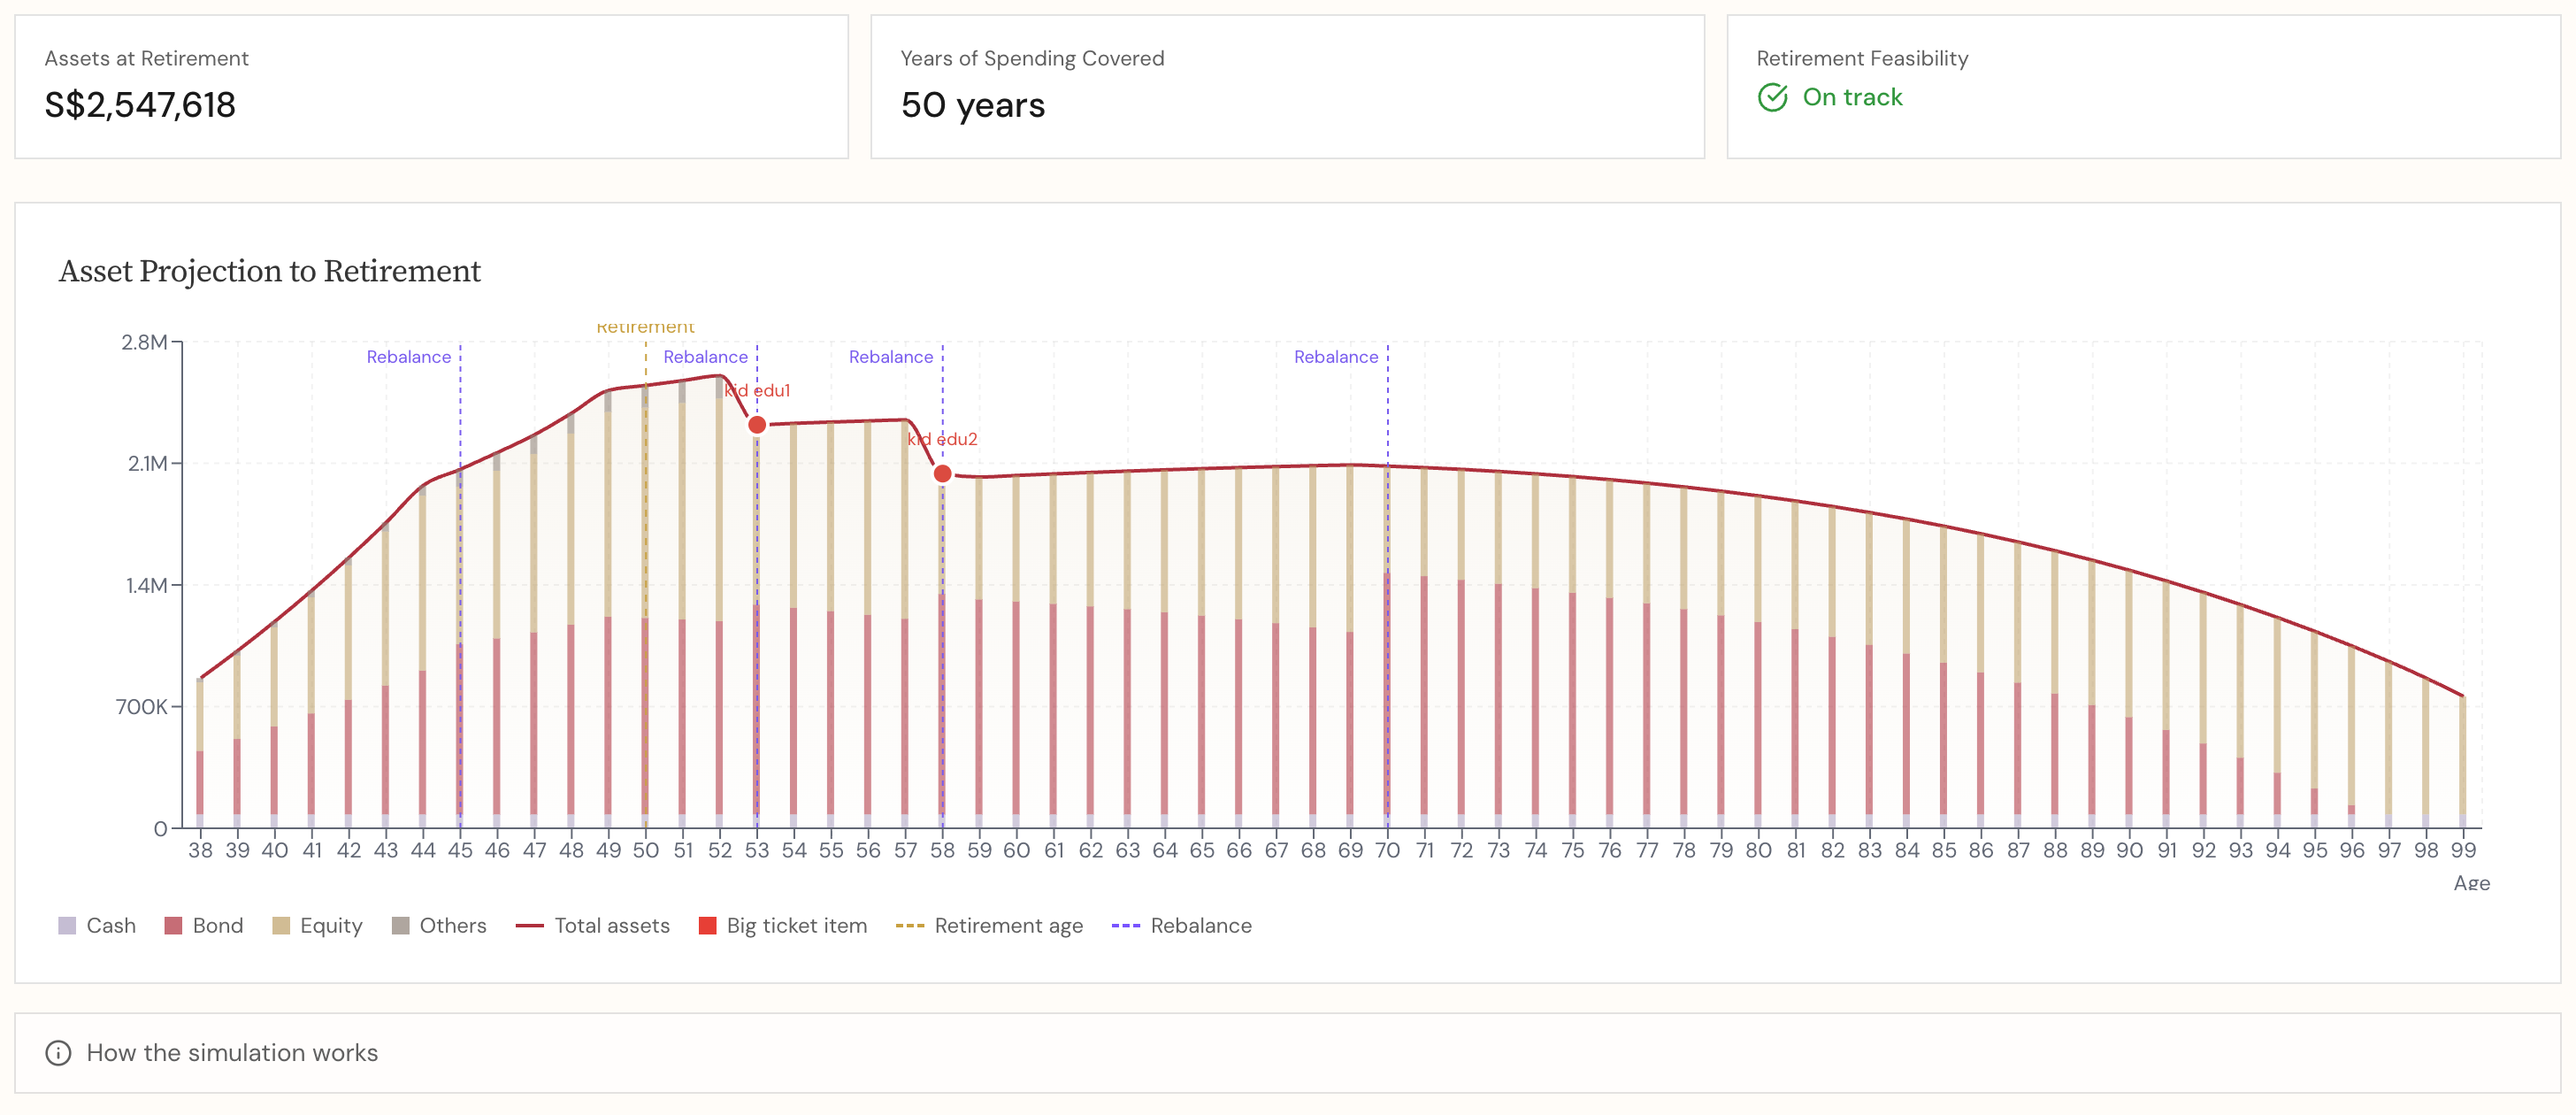
The output is a time-series projection of your net worth from today to age 99. You can see whether your current savings rate and investment return will get you across the line — and by how much.
What if markets return 5% instead of 7%? What if you take a two-year career break in 2029? What if university fees for two kids vary? You move the sliders and watch the projection change.
This was the question I was trying to answer with my five-tab spreadsheet: Am I on track? Now it’s one screen.
Plug in your actual spending number, your current investable net worth, and your target retirement age. See the result. If the line doesn’t cross the threshold, that tells you exactly what levers you need to pull — save more, earn more, spend less, or retire later.
🚀 How to Get Started
The tool ships with sample data so you can explore before inputting anything personal. There’s also an export feature to save your data as a file and reimport it later — useful if you clear your browser or switch devices.
If you’ve been doing your financial planning across multiple spreadsheets, or if you’ve been meaning to start but weren’t sure how to structure it — this is built for exactly that gap.
My Financial Planner
Track your portfolio, budget, and income flow with interactive visualizations. Plan your path to financial independence.
Try It NowRead More
Talking to Our Oncologist About the Cancer Drug List: Insurance Coverage and Real-World Challenges
Understanding Singapore's Cancer Drug List (CDL) and Non-CDL Framework: how they affect treatment options, insurance coverage, and the real challenges patients face when navigating cancer care.
Be Cautious with Persuaders in Your Wealth Management Journey
Inspired by Howard Marks's famous book The Most Important Things, I am sharing some thoughts about brokerages, fund firms, insurance companies and banks and how to navigate through the different service providers wisely.